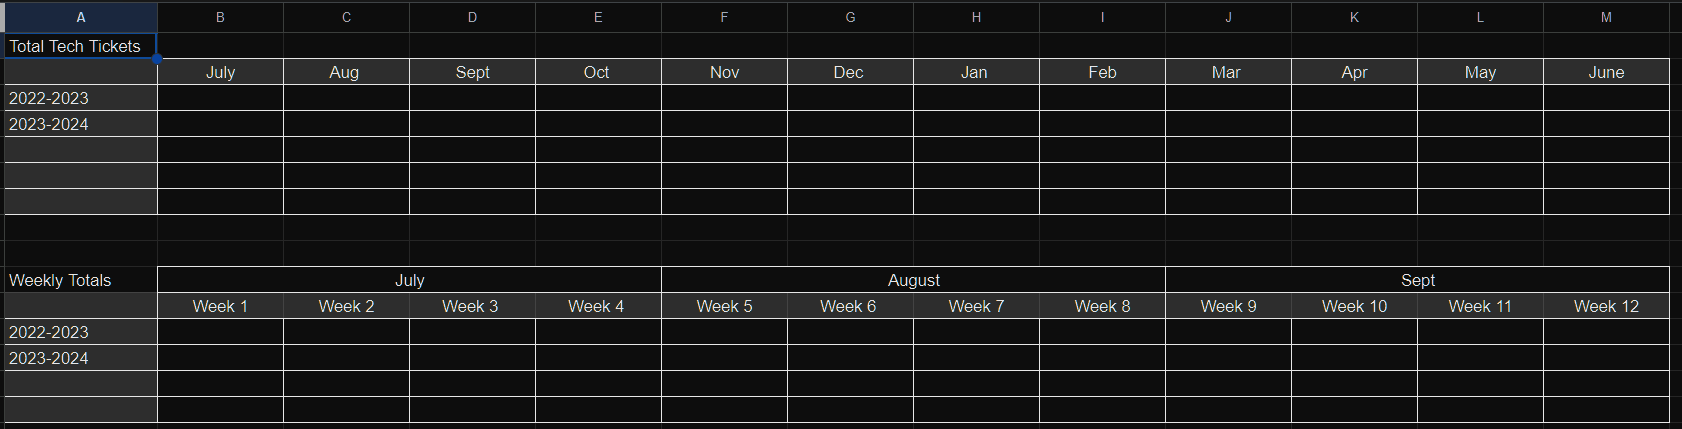
Hello, I’ve been asked to compare last years ticket count to this year. What is the best way to pull this information? They would like it broken down by Month and weekly view to show the busiest times of the year. Thank you in advance for your assistance.

Solved
Tech Ticket Comparison (Last year vs Current FY)
 +3
+3Best answer by Kathryn Carter
Unfortunately, I have only been able to find a clunky way of doing this.
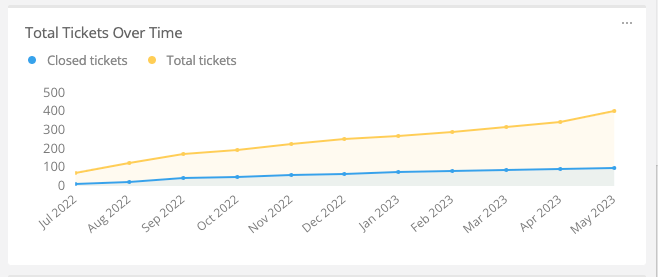
First, you can see the total tickets by month in analytics. Report / Ticket - select your date range. Then scroll, and you will see “Total tickets over time.” You can hover over each section, and it will give you the total number of tickets submitted:
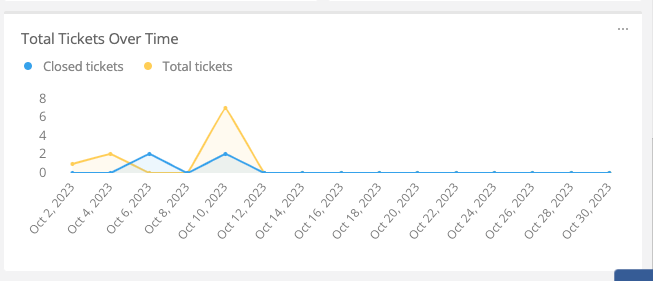
For weekly, you can adjust the time frame by month, and it will give you the total tickets as well. However, it does not have “Week 1” like your spreadsheet shows:
As I said, this is clunky and time-consuming, but it will probably be the best way to gather that information. You can save each module as an image or as a pdf as well. I hope this helps 😄


Enter your E-mail address. We'll send you an e-mail with instructions to reset your password.